7. Images, custom pointers and warning lights
This chapter covers the gauges that use your own files (pointer, GIF, image, SVG), the simple shapes, the group, and the rule that turns a warning light on and off. Buttons and cameras are in chapter 8. The fields common to every gauge are in section 6.1.
On the FT700 and FT700 Plus, the artwork is created on the PC and travels inside the map; the buttons that load a file do not appear in the editor on the FT700 itself. On the PC, phone and tablet they exist, but if the file is not accepted the app shows no message: after loading, check the gauge's status text (for example Loaded (W×H)) and, on the phone and tablet, check whether the file picker opens.
Styles: Text, Map name, Date/Time and Analog clock have Modern, Classic, Neon and Cyberpunk; the other gauges in this chapter and the cameras have only Modern, without the Style selector.
#7.1 Pointer PNG and SVG Pointer
The pointer rotates according to the value of a measurement and, if you want, also changes size. You draw the needle in an image editor, load the file and enter two pairs of value and angle. The Pointer PNG uses an image with transparency; the SVG Pointer, a vector drawing.
#How the pointer works
The pivot point is set in Pivot X and Pivot Y, in the Layout section: from 0 to 1 over the width and height of the box (default 0.5 and 0.5, the center). With the pointer selected, the editor shows a green handle at the pivot point: drag it or type the values.
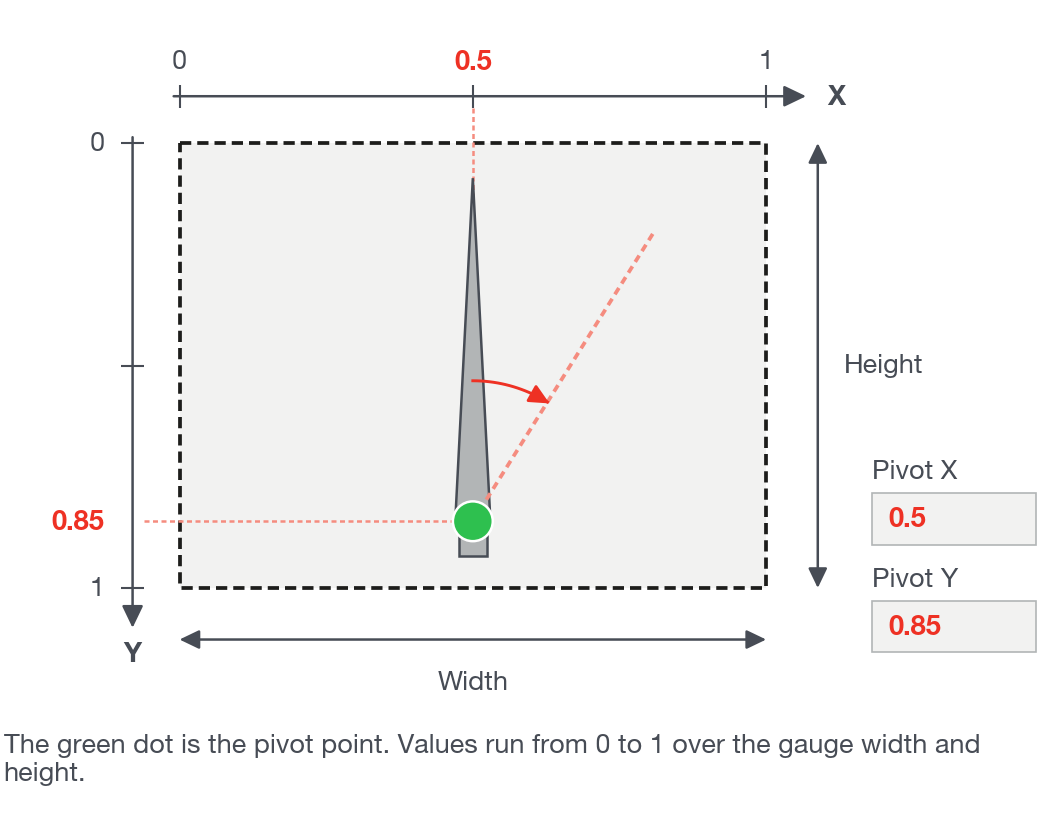
The pivot point is measured over the box, not over the image, which is centered in it. For it to match the position in the image, keep the box in the same proportion as the image, with Preserve aspect ratio on and Automatic (uses component size) checked.
You enter Value 1 with Angle 1 and Value 2 with Angle 2; between them the angle varies in a straight line with the value:
angle = Angle 1 + (value - Value 1) / (Value 2 - Value 1) x (Angle 2 - Angle 1)
The angle is measured in degrees from the position in which the image was drawn; the positive direction is clockwise.
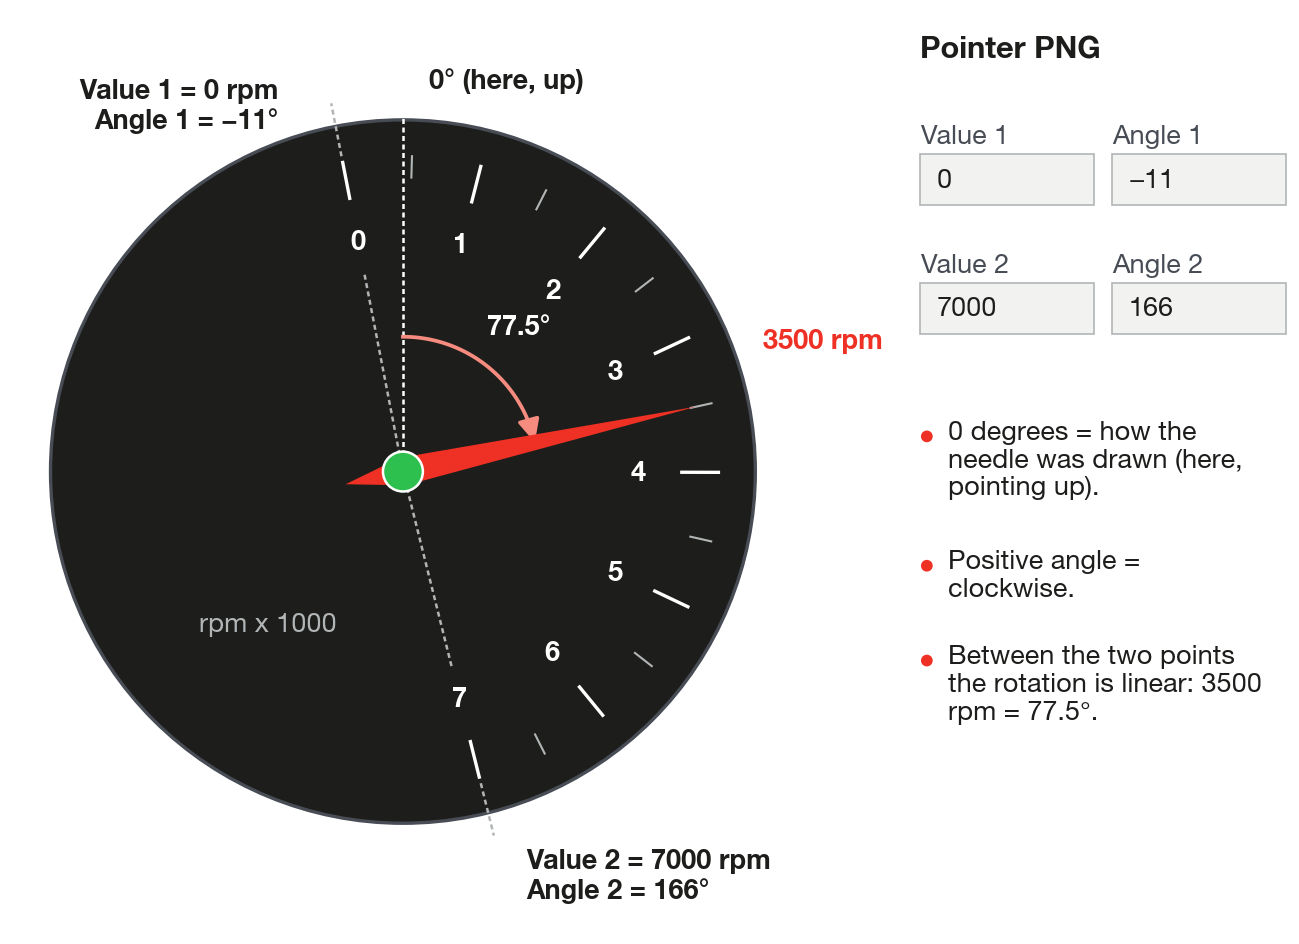
The pointer has no stop at the ends: above Value 2 the needle keeps rotating beyond Angle 2, and below Value 1 it rotates backward beyond Angle 1. Set Value 2 equal to the end of the drawing's scale and check what the needle does above it.
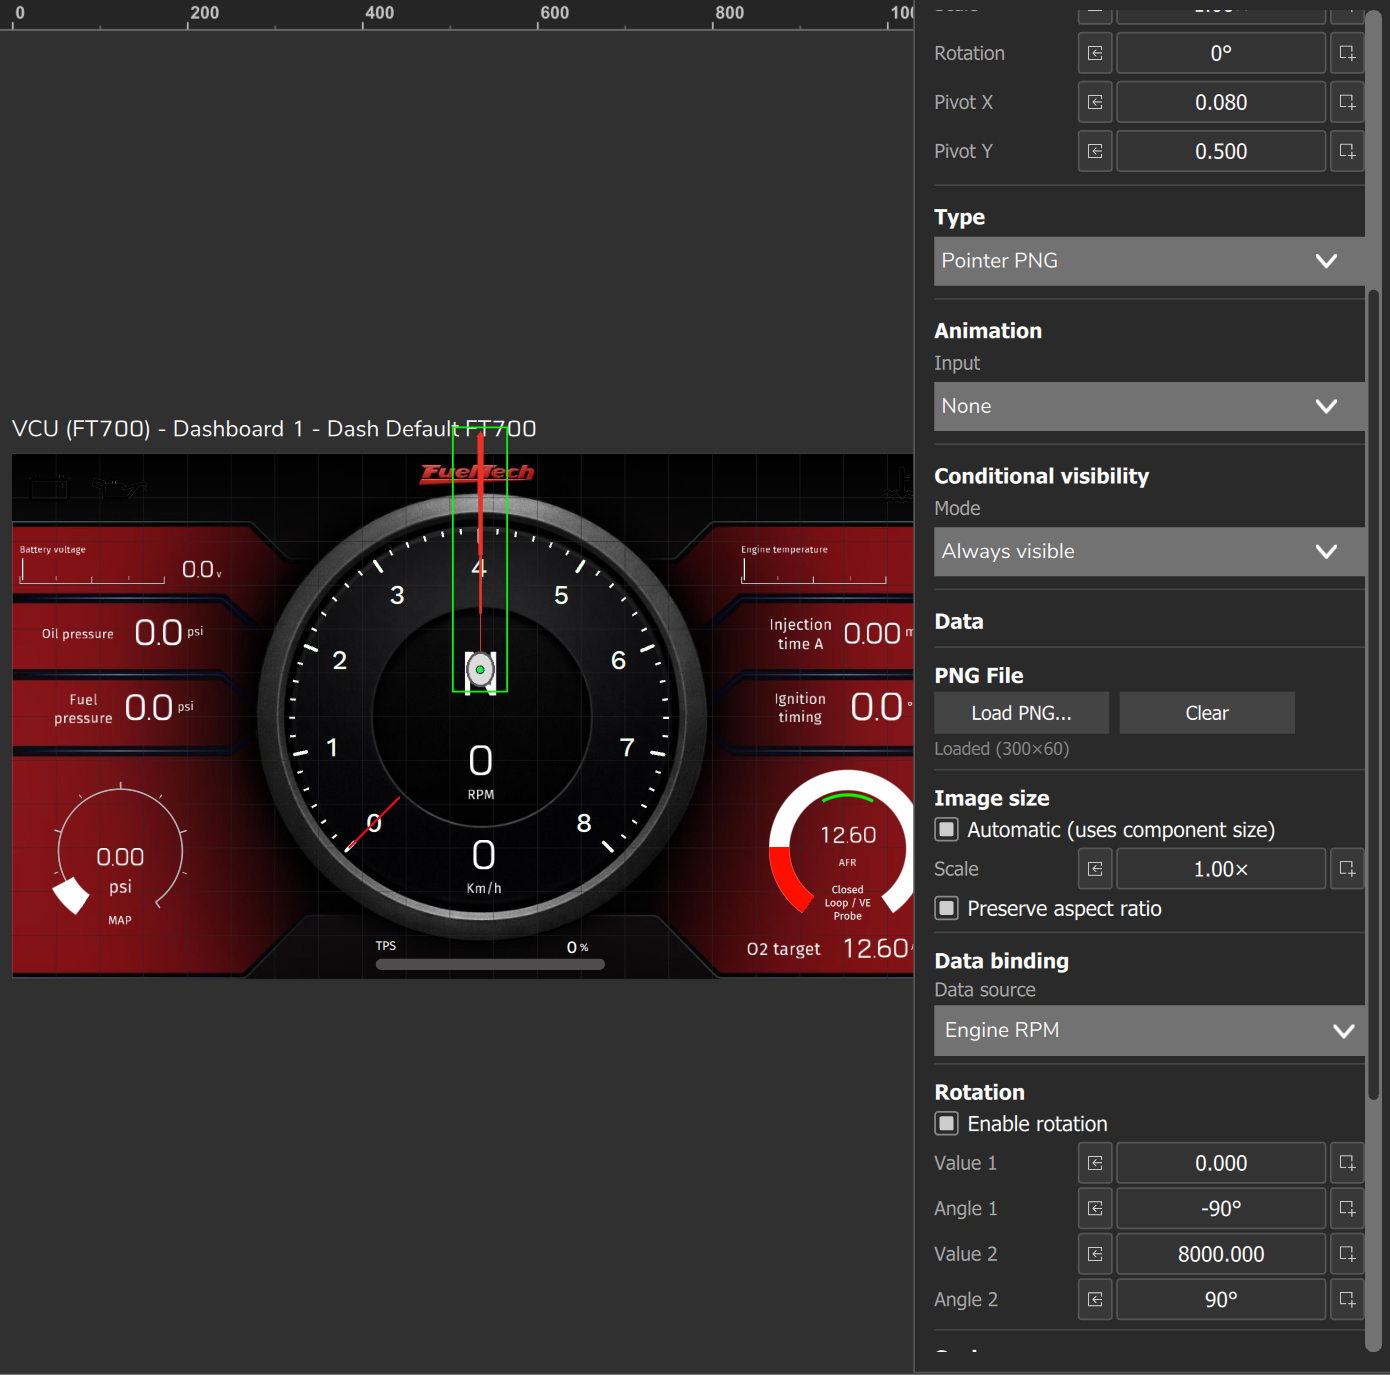
Enable rotation must be checked, or the needle does not rotate. Type the values in the unit the map uses; if you change the unit later, the values move to the new unit and the needle stays in the same place. When you choose the Data source, the values stay at 0 and 100 until you type your own (on the tachometer, the end of the scale in Value 2). The editor has no data simulator: with no VCU connected since you opened FuelTech Vision, the measurement value is 0 and, with Value 1 at 0, the needle stays at Angle 1. The step-by-step procedure to calibrate without starting the car is in section 10.3.
#Pointer PNG
Rotates a PNG image around a point according to the value of a measurement from the list, in Data source (Data binding section; with no source, the value is 0).
- PNG File: Load PNG... and Clear. The app saves PNG with transparency, at most 512 px per side, without enlarging.
- Image size: Automatic (uses component size) comes checked; when unchecked, Width and Height (1 to 10000 px) and Scale (0.01x to 100x, default 1x) appear. Preserve aspect ratio (on) keeps the whole image in the box; off, it stretches.
- Enable rotation and Enable scaling come turned off. Rotation default: Value 1 0, Angle 1 -90°, Value 2 100, Angle 2 90° (angle from -3600° to 3600°). Scaling default: Value 1 0, Scaling 1 1, Value 2 100, Scaling 2 1 (factor from 0.01x to 100x, no stop at the ends; it changes only the image).
- Plot edge and Plot background (edge and background of the pointer box) come turned off and rotate together with the needle: leave them that way. The color selector offers a gradient, but the Pointer PNG uses only the first color.
#SVG Pointer
Rotates a vector drawing around a point according to the value of a measurement, redrawn at the gauge's size, with no resolution limit. Data, rotation, scaling, Image size, Preserve aspect ratio, Plot edge and Plot background are the same as in the Pointer PNG; here the color gradient is drawn.
- SVG file: Load SVG... and Clear. The app reads the whole file as text, with no size limit. Loaded (N bytes) shows characters, not bytes.
- SVG Color (Color field): empty keeps the colors of the file. With a color, the app rewrites every declared fill and stroke (except those declared as none); the transparency of a solid color is discarded. If a part does not change color, declare its fill in the file.
For a large, sharp needle, prefer the SVG Pointer: the Pointer PNG never goes above 512 px per side.
#7.2 GIF
The GIF shows one frame of an animation according to the value of a measurement (Position mode) or changes the speed of the animation (Speed mode). In the app the word is "frame"; the Mode list shows a pair in parentheses in each option, and this guide uses only the short names.
#Position mode
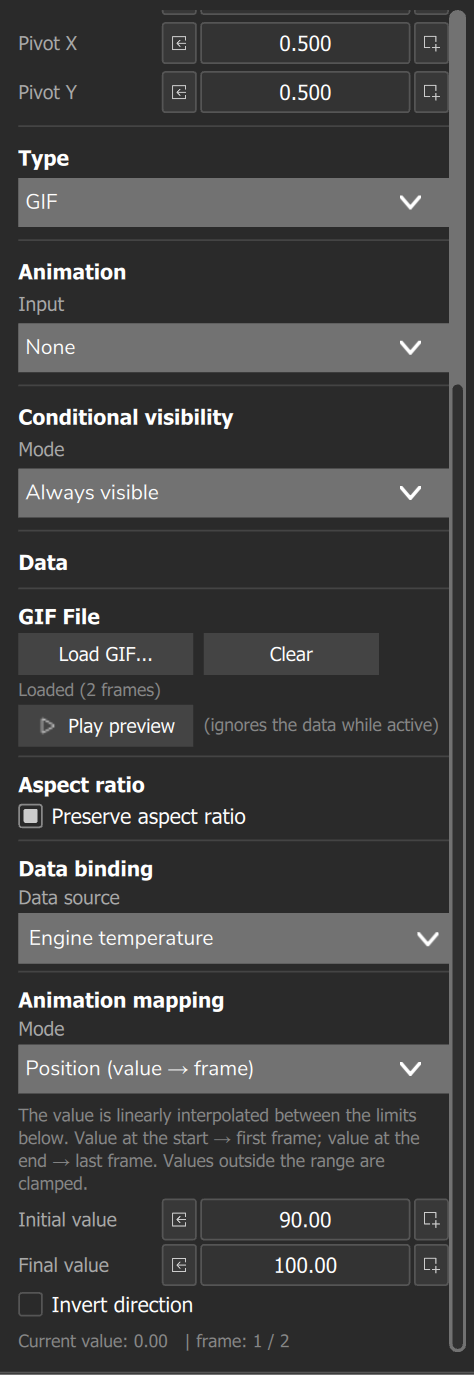
In Initial value you enter the value at which the first frame is shown; in Final value, the value for the last one. The conversion is:
t = (value - Initial value) / (Final value - Initial value), limited between 0 and 1
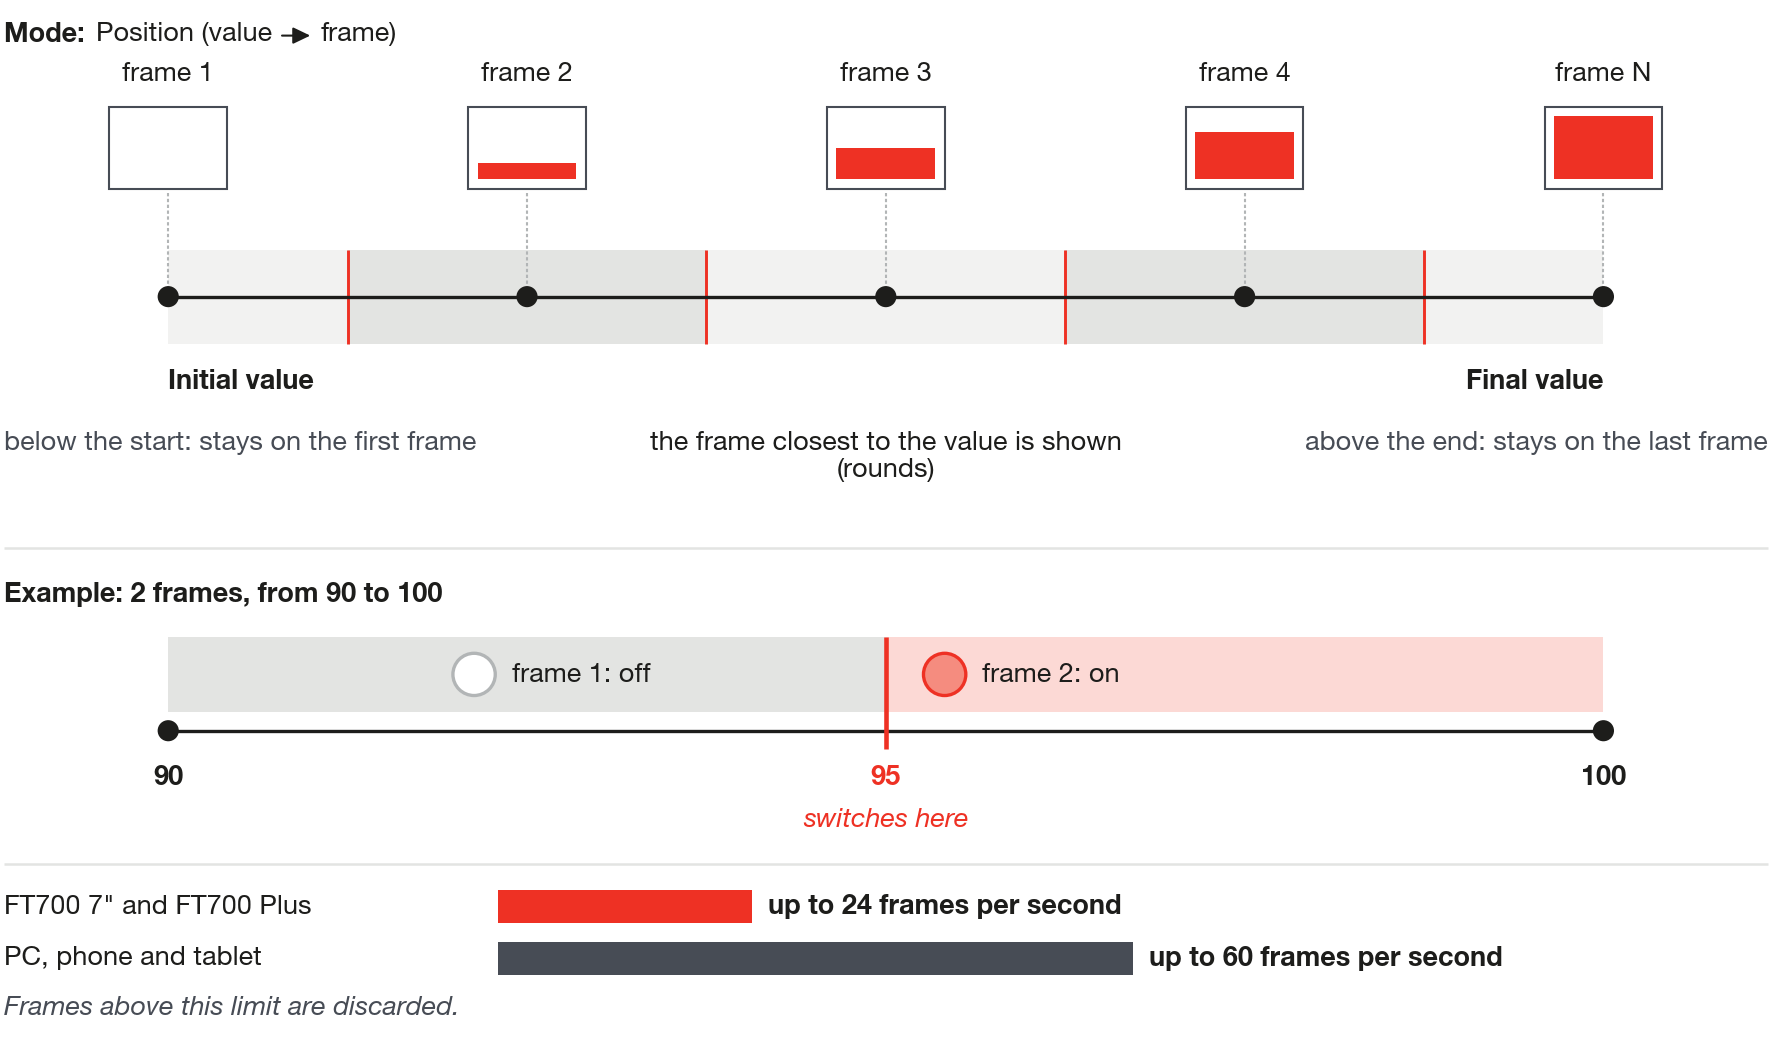
The frame shown is the one closest to t x (N - 1), where N is the number of frames; on a tie, the next one wins. Outside the range the GIF is held at the first or the last frame: unlike the pointer, it has a stop at the ends. Type the values in the unit the map uses.
In a 2-frame light (off, on) with start 90 and end 100, the light turns on at 95, the midpoint, not at 100. To turn on at a limit X, use X minus d as the start and X plus d as the end, with d greater than the smallest variation of the measurement (for 95: 94 and 96). The RPM bar and the frame-by-frame table are in section 10.5.
#Speed mode
The measurement controls the speed: Value 1 with Speed 1 and Value 2 with Speed 2. The speed is a multiplier of the file's rate, from 0 to 10 in steps of 0.1 (0 stops the GIF, 1 plays at the file's rate); between the points it varies in a straight line and outside them it is held at the value of the nearest point. The effective rate (multiplier times the file's frames per second) has a ceiling of 200 frames per second.
#How many frames the device keeps
The app keeps frames according to a rate: the total duration of the GIF times 24 frames per second (fps) on both FT700 models (7" and Plus), or 60 fps on the PC, phone and tablet, with a ceiling of 300 frames; the original first and last frames are kept. The Position mode calculation uses the N after frame dropping (Loaded (N frames)), so the same GIF can have a different N on the PC and on the FT700.
For the same N on the FT700 and the PC, use an average delay of 50 ms or more per frame (frame dropping on the FT700 starts below about 41.7 ms). A 2-frame light escapes frame dropping only if the sum of the two delays is 42 ms or more; with 2 frames of 20 ms, the FT700 keeps only the last one and the light always stays on it.
The app does not limit the size of the GIF file: use the smallest size in pixels that meets your need and few frames. How many GIFs per screen the FT700 can handle is something you check on your own dashboard: chapter 14 explains how. With no Data source, or with Play preview on, the GIF plays in a loop at the file's rate; for a still piece, use Image (7.3).
#GIF
Animates a GIF file according to a numeric measurement from the list, in Data source. Preserve aspect ratio (Aspect ratio section) comes turned on.
- GIF File: Load GIF... and Clear; it shows Loading GIF… and then Loaded (N frames).
- Play preview: only with a data source; it plays in the editor, ignoring the data. Pause preview stops it.
- Mode (Animation mapping section): Position (default; Initial value and Final value, default 0 and 100, from -100000 to 100000) or Speed (Value 1, Speed 1, Value 2 and Speed 2, default 0, 0, 100 and 1). Invert direction swaps start and end or plays backward.
#7.3 Image and SVG
Image places a fixed PNG or JPEG on the dashboard; SVG Button, a vector drawing that turns on and off according to a measurement. Neither rotates by value: for that, use the pointer (7.1). Each image goes inside the map and increases its size. The app reduces and converts without warning, and only reduces above the ceiling: reduce each file to its working size before loading. Ceilings per side: Pointer PNG, 512 px; Image, 1920 px; GIF, decoded between 256 and 1280 px; background (chapter 5), the target's resolution, as JPEG at quality 85; SVG, no ceiling.
#Image
Shows a fixed PNG or JPEG: warning light, logo, frame or any fixed artwork. It uses no data: to show or hide it according to a measurement, use Conditional visibility (7.5).
- Image file: Load image… and Clear. Status: Loaded (W × H) or No image loaded.
- PNG or JPEG up to 1920 px per side stay as they are; above that, or in another format, the app rewrites the file: PNG if it has transparency, otherwise JPEG at quality 90, keeping the proportion.
- Preserve aspect ratio (Aspect ratio section): on, the whole image fits in the box; off, it stretches.
#SVG Button
Vector indicator that changes color, and can blink, with an on/off measurement, in Data source (flag): on with a value different from 0.
- SVG file: Load SVG... and Clear.
- Color off (default white; the default color keeps the colors of the file) and Color on (default red; accepts a gradient).
- Blink when on (off by default): the image alternates between the on color and the off color; it does not disappear. Frequency (Hz): default 2; the field accepts only integers, use 1 to 10.
Despite the name, the SVG Button is not a button: it does not respond to touch. For a button that commands the VCU, use the ECU Button (8.1).
#7.4 Shapes and Group
Shapes are gauges without data. Thickness, radii and length accept only integers in the editor.
#Text
Writes a word or phrase, which is the Custom title field (Title section; default: the word Text, in the app's language); Show title (Visibility section) turns the text on and off. The text size is 40% of the shorter side of the box, with line wrapping: for larger text, enlarge the box. Cyberpunk writes in uppercase and in bold.
#Line
Draws a horizontal line in the middle of the box, from end to end; for a vertical or slanted line, use Rotation. Length (Dimensions section) is the width of the box, Thickness (Appearance section) has a default of 2, and Arrow at the beginning and Arrow at the end (Arrows section) come turned off.
#Circle, Square and Triangle
The Circle is the ellipse inscribed in the box; the Square is a rectangle with rounded corners; the Triangle is isosceles, with the tip at the middle of the top edge (rotate it with Rotation). All three have Show edge and Show background (Visibility section, on), Thickness (default 2) and Edge color in the Edge section, drawn inside the shape, and Background color in the Background section. Only the Square has Corner radius (Top left, Top right, Bottom left and Bottom right, 0 to 9999 px; default 0, square corner).
#Group
Gathers gauges into a single layer, to move, rotate, scale and hide together. It is not in the palette: it is created by Group (Ctrl+G), with 2 or more items that are not groups; Ungroup is Ctrl+U (section 4.4). The group takes up the box that encloses the items, with Scale 1; the group's Scale multiplies the position and size of all the items, and Width and Height are locked. The group with Scale is the manual method to take a dashboard to another target (section 11.5).
When the map is opened, the app reads the items of a group in alphabetical order of the internal name, not by the saved position: with overlapping items, check the order after saving and reopening.
#7.5 Warning lights: Conditional visibility
A warning light is a gauge (image, shape, text or GIF) that appears or goes off according to a measurement. The rule is Conditional visibility, a section of the properties panel of every gauge. There are three ways to build the light: Image with the rule (any mode; hysteresis in the Above and Below modes); a 2-frame GIF (7.2), which turns on at the midpoint, with no hysteresis; and SVG Button (7.3), only for an on/off measurement.
#The Conditional visibility fields
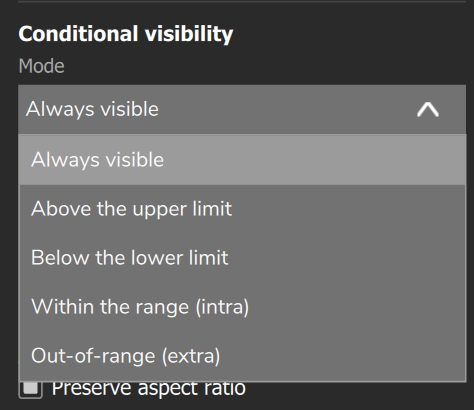
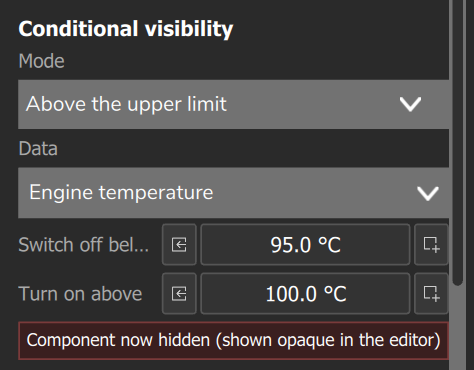
The section has the Mode selector (title Visibility mode), the Data field and two limit fields, whose label changes with the mode. A strip shows the state: Component now visible (green) or Component now hidden (shown opaque in the editor) (red; despite the label, the editor draws the hidden gauge dimmed, at 30% opacity). Type the limits in the unit the map uses; if the measurement has text (gear, gearbox position, on/off), the limit becomes a list with those texts.
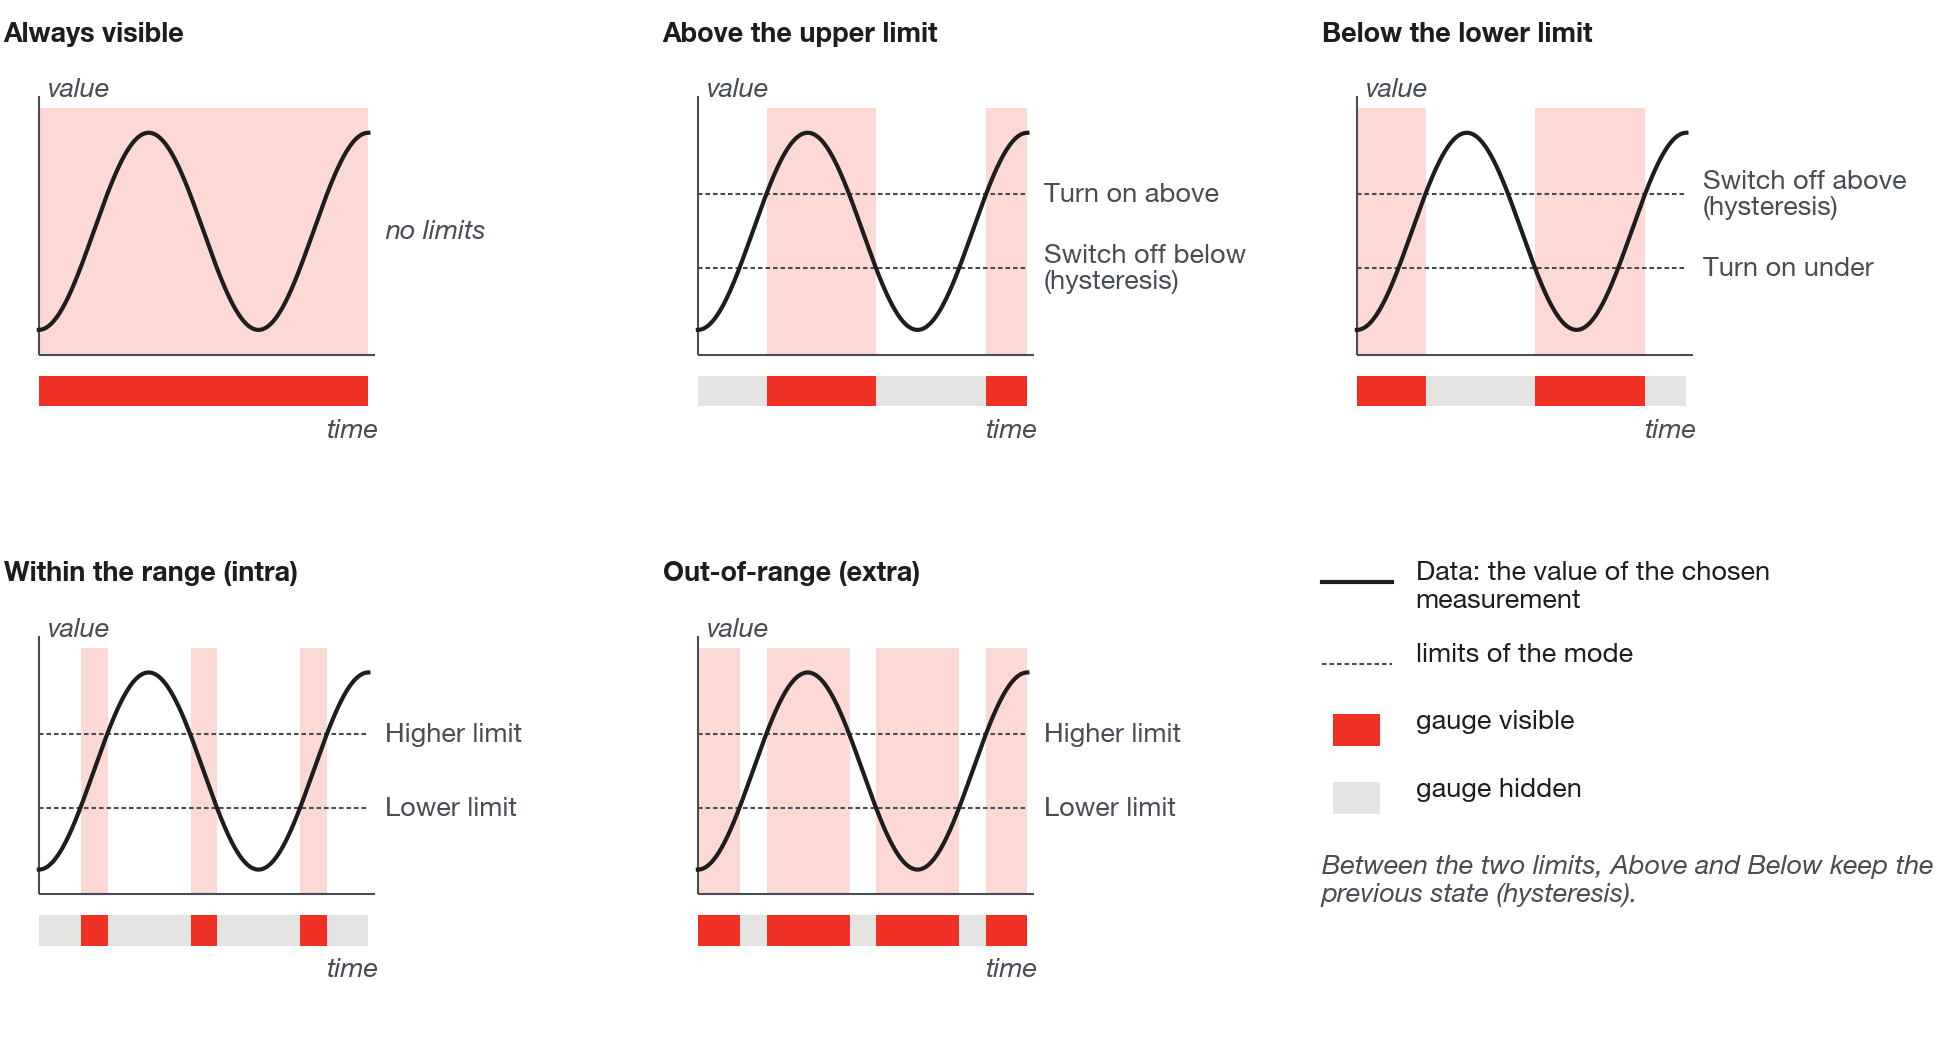
| Mode | Bottom field | Top field | Rule |
|---|---|---|---|
| Always visible | hidden | hidden | Always shows (default). |
| Above the upper limit | Switch off below (hysteresis) | Turn on above | Turns on above the top field's value and off below the bottom field's value; between the two, it keeps its state. |
| Below the lower limit | Turn on under | Switch off above (hysteresis) | Turns on below the bottom field's value and off above the top field's value; between the two, it keeps its state. |
| Within the range (intra) | Lower limit | Higher limit | Shows when the value is between the limits, inclusive. No hysteresis. |
| Out-of-range (extra) | Lower limit | Higher limit | Shows below the lower limit or above the higher limit. No hysteresis. |
Hysteresis is the difference between the value that turns the light on and the value that turns it off. The app does not check that the bottom limit is smaller than the top one: in the Above and Below modes, with the bottom one larger, the turn-on condition wins; with both equal, there is a single switching point.
In the editor, a gauge hidden by the rule is shown at 30% opacity; on the running dashboard, it disappears. The step-by-step procedure for an engine temperature light (turns on above 100 °C, goes off below 95 °C) and for an on/off measurement, such as the high beam, is in section 10.4.
#What the light does when there is no data
With no data, every measurement starts at 0; lambda, at 1. With no measurement in Data, the gauge always shows. The PC editor has no simulator: with no VCU connected since it was opened, it uses the value 0. With 0: Above the upper limit is off if Switch off below (hysteresis) is greater than 0, and on without going off if it is 0 or negative; Below the lower limit is on if Turn on under is greater than 0; Within the range (intra) shows only if the range includes 0; Out-of-range (extra), only if 0 is outside it.
If the connection to the VCU drops (PC, phone and tablet), the measurements stay at the last value (in the editor, until you close and reopen the app), and only the engine RPM goes back to 0: a light that is on stays on (section 9.6).
With no data, lambda is 1, not 0: depending on the limits, a lambda light can appear on with no data. Check each lambda light without a VCU and in the unit chosen in the map.
#Where to edit Conditional visibility
The PC editor, the FT700 7" editor, the FT700 Plus editor and the phone editor have the Conditional visibility section. The tablet editor does not create or change the rule, but the tablet display applies the rule made in another editor. With an FT470, the Data measurement is not included in the request for measurements that the app makes (section 9.5): if the light does not respond, test with a measurement from the base set.
#7.6 Map name, Date and time, Analog clock
#Map name
Shows the name of the active map and follows the switching or renaming of the map. Colors and background work as in Text, and the text size is also 40% of the shorter side of the box.
#Date/Time
Shows the time and the date; in the palette the name is Date/Time, in the map Date and time.
- Parameter: number from 0 to 7. 24-hour time with 0 to 3 and 12-hour time, with AM or PM, with 4 to 7. Date: 0 and 4, day/month/year (13/10/2026); 1 and 5, month/day/year (10/13/2026); 2 and 6, year-month-day (2026-10-13); 3 and 7, no date.
On the PC, phone and tablet the time is that of the device; on the FT700 and FT700 Plus, it is that of the VCU clock, which by default FuelTech Vision sets when it connects. The adjustment is on the Date and time settings screen (My VCU menu on the PC, VCU on the FT700 and FT700 Plus; the phone and tablet do not have the screen): Sync Date and Time copies the device time to the VCU; on the PC, Auto sync when connect turns the automatic adjustment on and off.
The VCU refuses the adjustment if the date is outside 2020 to 2099, or if the jump is larger than 7 days with its clock at a date equal to or later than the date of the software version. The Date and time adjustment refused warning exists only on the FT700 screen; on the PC, phone and tablet the refusal does not appear. The time zone of the device that synchronizes is not used: after connecting, check the local time on the FT700.
#Analog clock
Shows the time with hands, from the device clock. Show background, Show ticks and circle and Show hour numbers (Visibility section) come turned on; the colors are in the Colors section. There is no seconds hand.