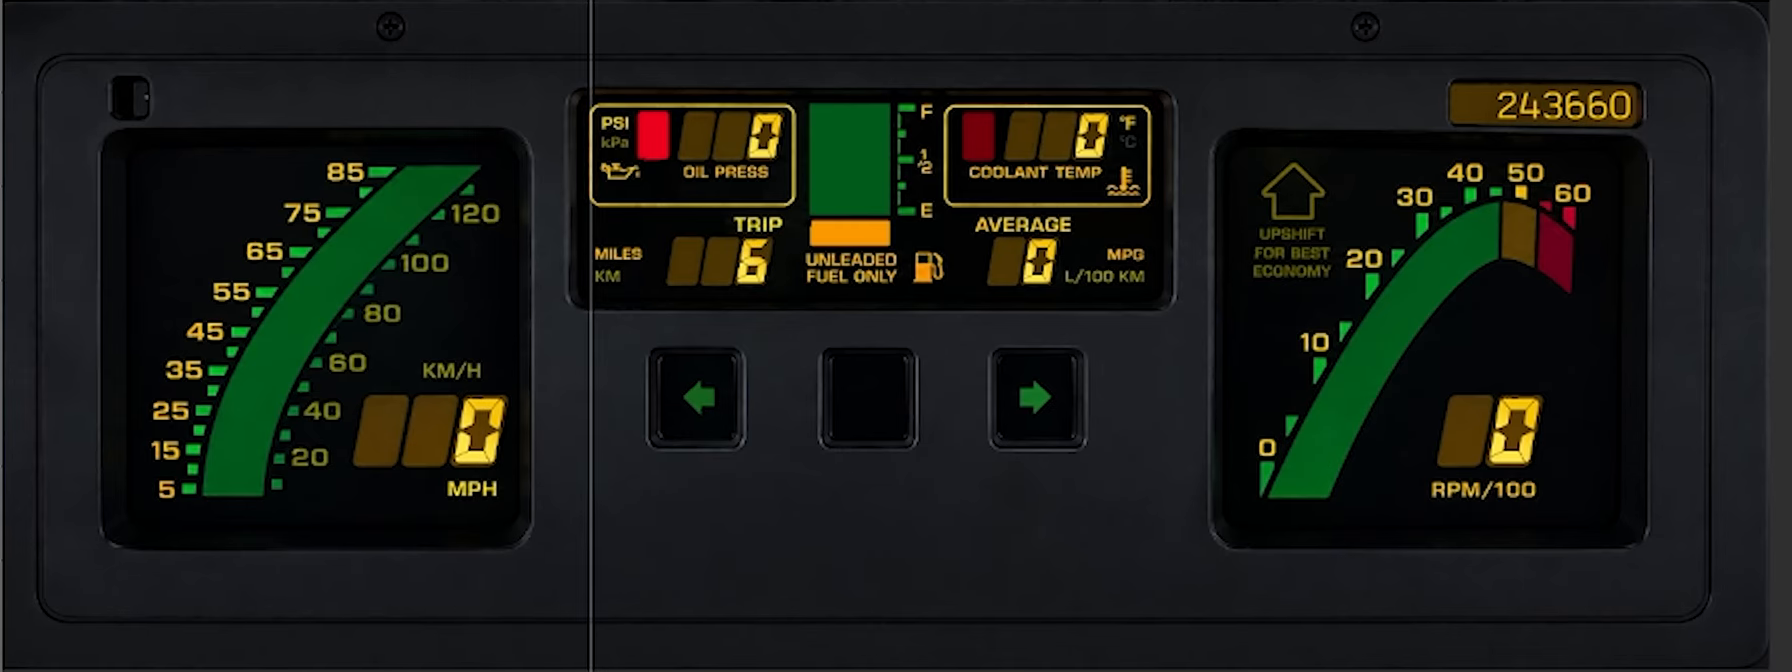
10. Step-by-step method: replicating a classic dashboard
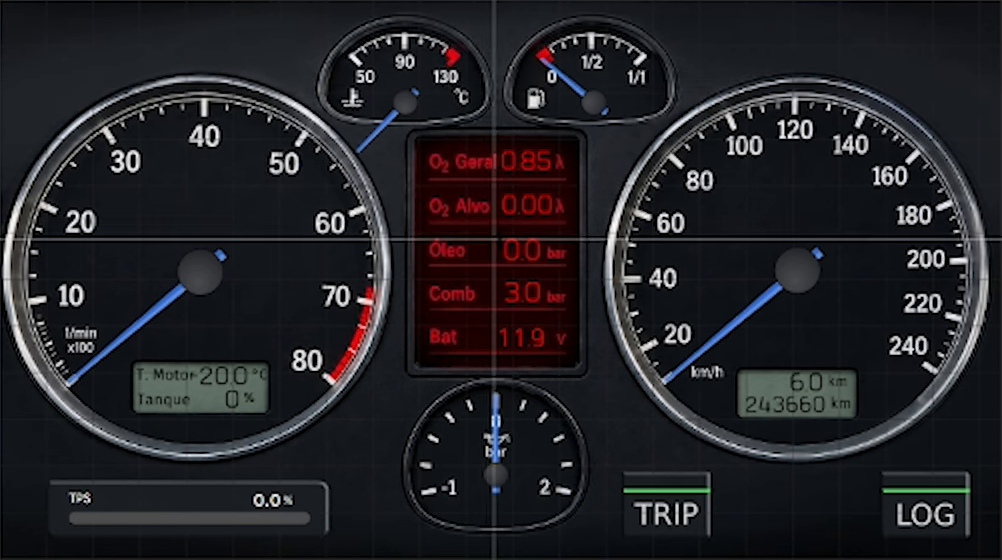
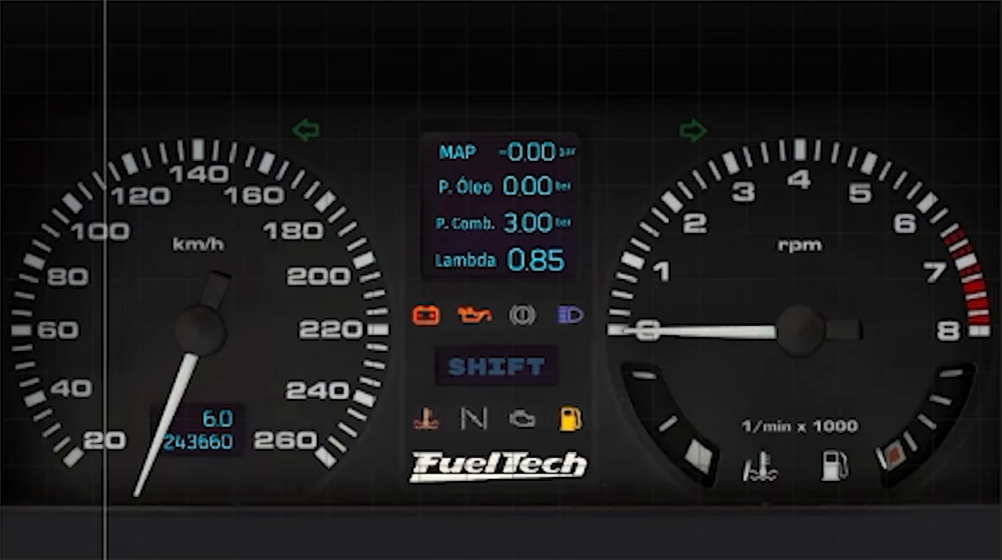
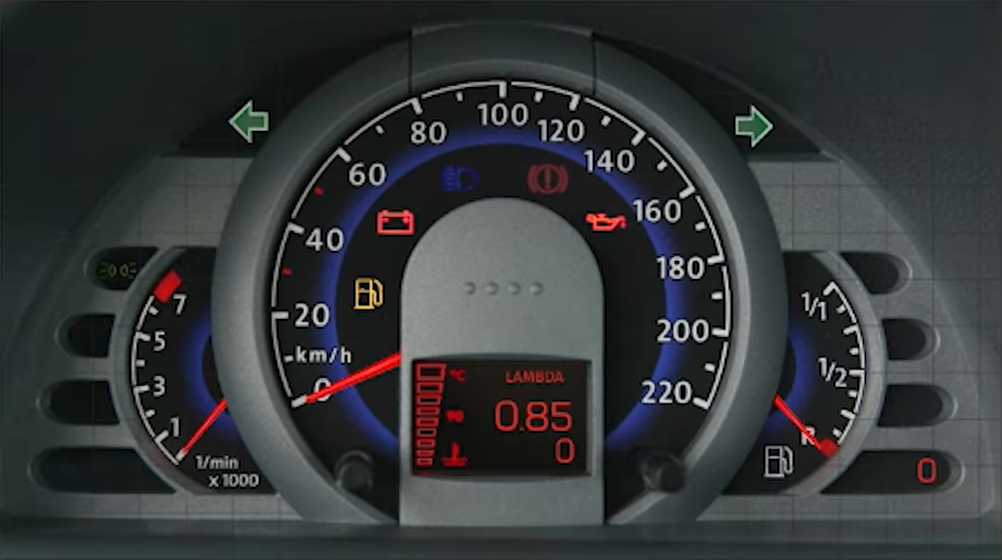
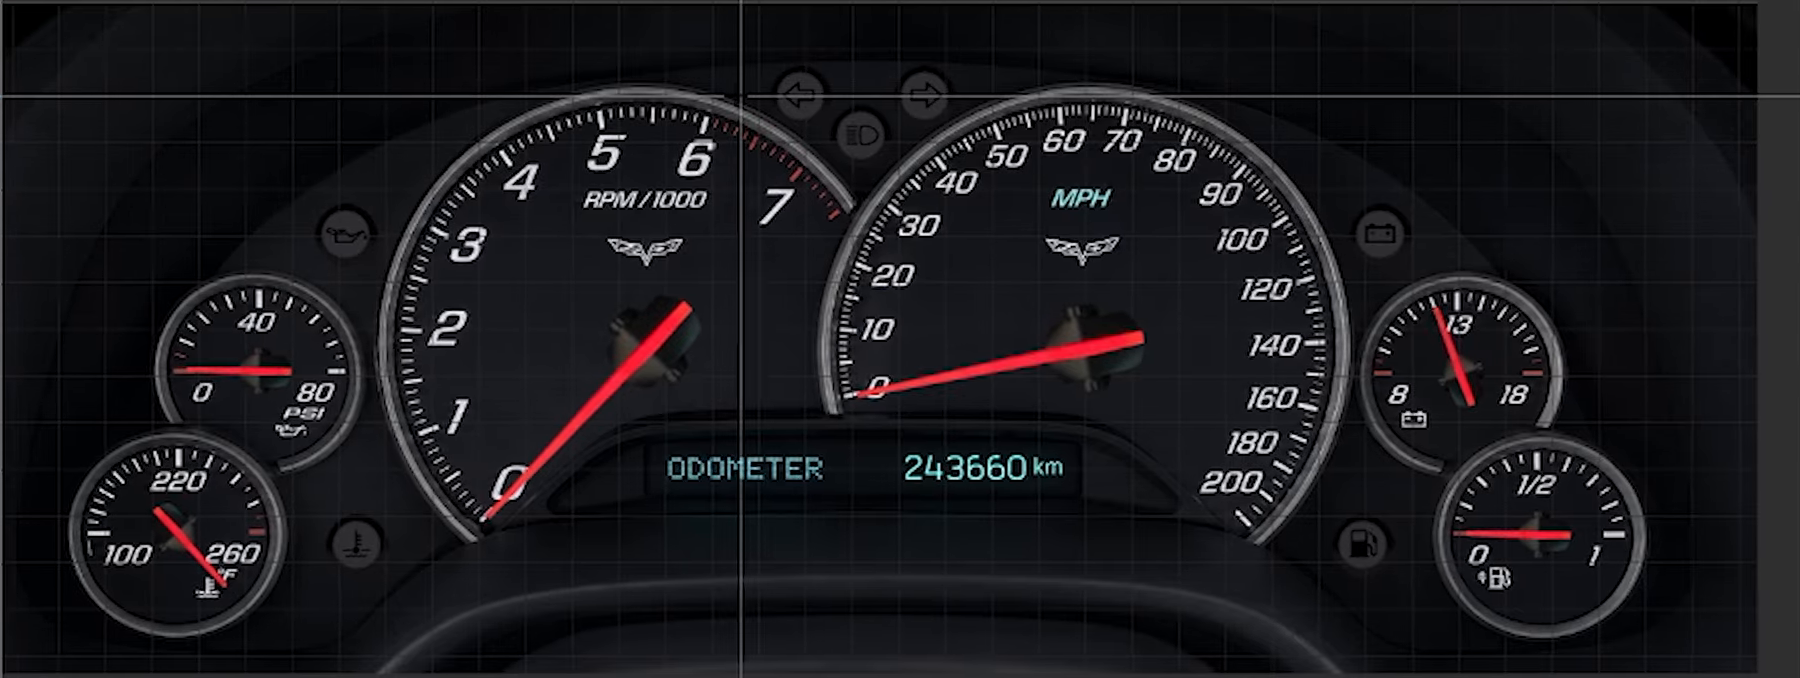
This chapter teaches how to copy a classic car's dashboard onto the FT700 dashboard: a background with the dial faces, needles, warning lights and an RPM bar that lights up in steps. The method is the one from the video "Do Calibra ao Corvette" ("From Calibra to Corvette") (FT Education), and the numbers in the examples come from it: for your car, measure and recalculate each one.
All the work happens in the PC editor, with the map open: in the FT700's own editors the buttons for loading a file do not appear, and the background, the Pointer PNG, the GIF and the Image come in by file. Nothing reaches the VCU before Write (section 10.7).
#10.1 What you need
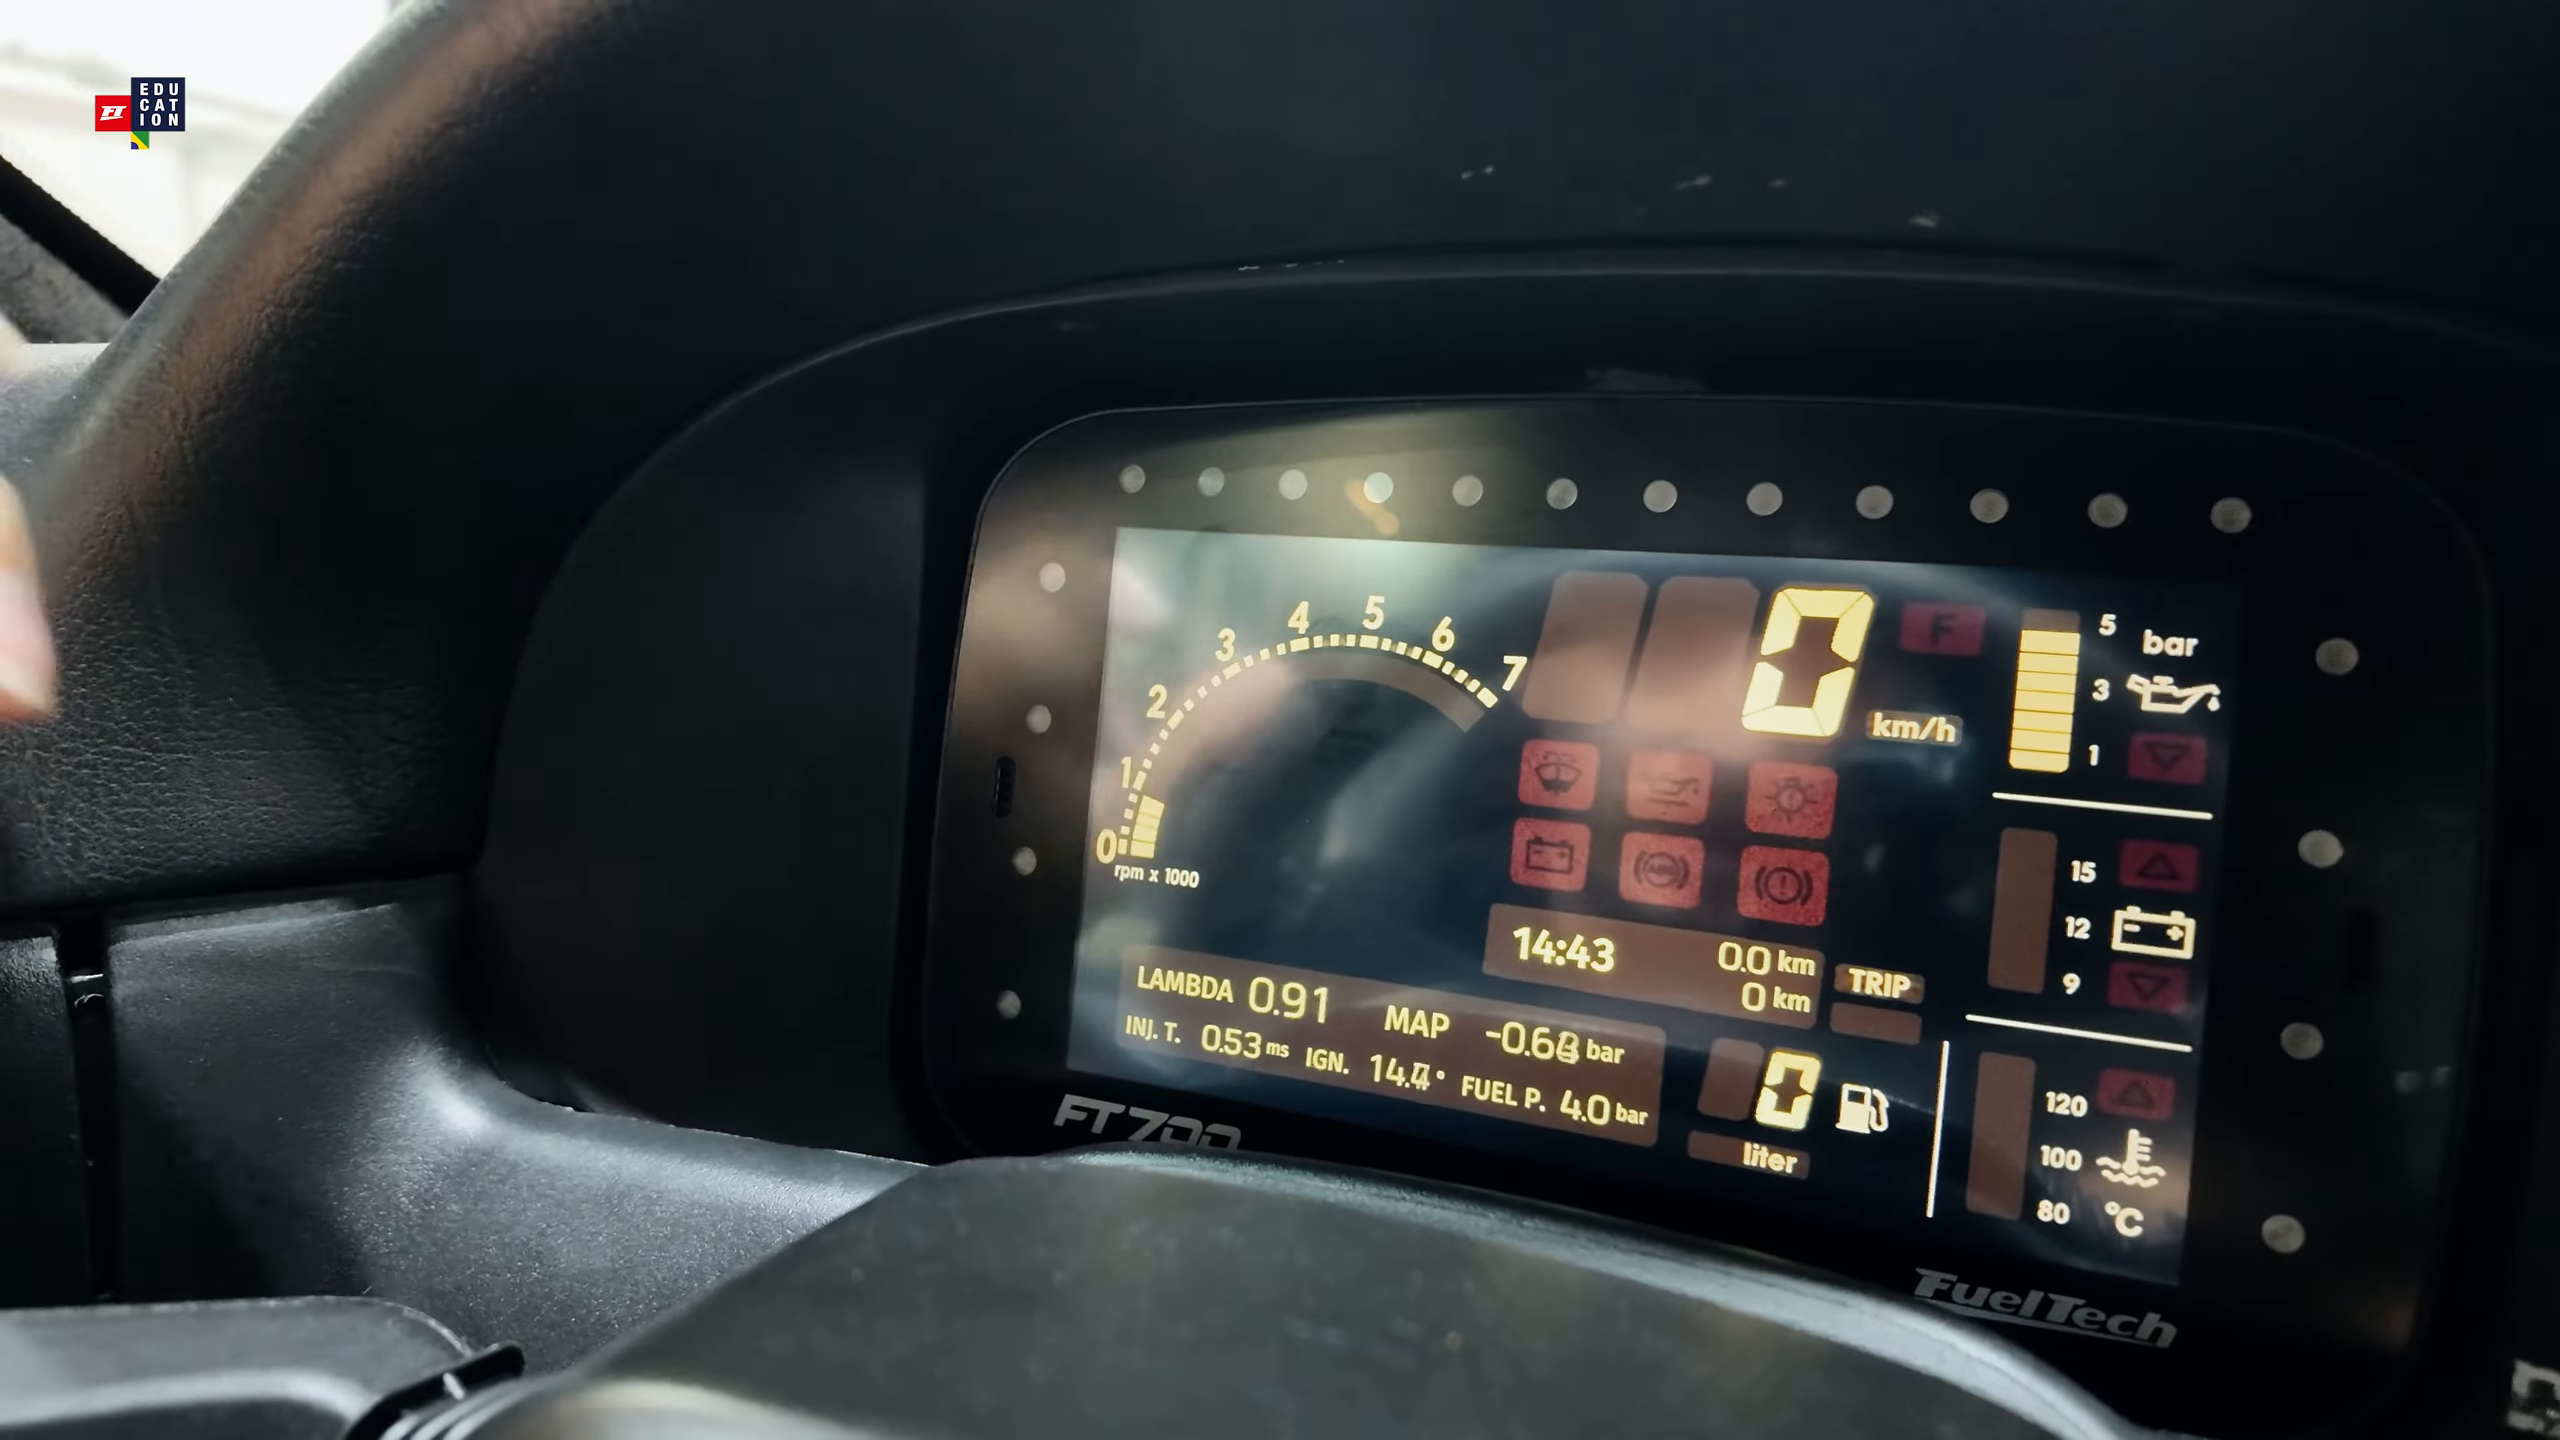
Gather three things before opening the editor.
- An image of the original dashboard, seen from the front. Photograph it with the camera on the axis of the dashboard, with no tilt and with the whole scale visible: with perspective, the arc becomes an ellipse and the needle, which turns in a perfect circle, does not follow the marks. A processed photo, a drawing or artwork from an image program will do (one that exports PNG with transparency and animated GIF, for the needle and the lights).
- The right target. Choose the target in the Device: list in the top bar of the editor, before building anything. The 7" FT700 uses VCU (FT700), 1074 x 600 px. The FT700 Plus uses VCU (FT700 Plus), 1920 x 720 px. Both sizes are fixed (sections 1.2 and 2.2).
- The values measured on the original. For each instrument, note the measurement it shows, the value of the first mark and of the last mark (on the tank, empty and full, in percent) and whether the marks are evenly spaced.
Choose each measurement in the Data source field (use Search in the selector): tachometer, Engine RPM; speedometer, Speed; coolant temperature, Engine temperature; oil pressure, Oil pressure; battery voltage, Battery voltage; fuel level, Fuel Level Percentage. The full table is in section 9.2.
Each file type has its own rule. Prepare the file already within it, and the application does not need to shrink it.
| File | Formats | What FuelTech Vision does |
|---|---|---|
| Background | PNG, JPG, JPEG, BMP | Reduces to the target size, never enlarges, and saves as JPEG at quality 85, with no transparency |
| Needle | PNG, or SVG in SVG Pointer | PNG: reduces to at most 512 px on the longest side and saves as PNG with transparency. SVG: no size cap |
| Light or icon | PNG, JPG, JPEG | Up to 1920 px per side stay as they are. Above that the application reduces them |
| Animated bar or light | GIF | No file size limit. Decodes up to 1280 px on the longest side. Keeps at most 300 frames |
Here the face of the instrument is painted on the background, and needles, lights and bars come in on top as gauges (in the native gauges, chapter 6, FuelTech Vision draws the scale and the numbers). What is painted is fixed: if the end of the scale changes, the artwork has to be redone.
Before you start, keep a copy of the map (section 2.1): Write replaces the VCU's active map and, on the PC, also overwrites the open file.
#10.2 Background of the original dashboard at the target size
The background is the image in the Screen tab, stored inside the map (rule in the table in section 10.1). The size of your artwork decides the quality of the result.
- Crop the photo to the target's proportion and resize it to the exact size: 1074 x 600 px for VCU (FT700) and 1920 x 720 px for VCU (FT700 Plus). On the 7", use 1074 x 600 and not 1024 x 600: the application compresses the width on the display, and artwork drawn at 1074 x 600 keeps the circles round (section 2.3).
- In the editor, open the Screen tab. In Day mode background, choose the type Image (the selector has three icons, with the tooltips Solid color, Image and Animation) and use Add image.
- In Position, leave Fill.
- Check the "N x M px" size the screen reports, already after the reduction: it must be the target's. If it is smaller, the image is stretched and loses sharpness.
Fill, the default position, stretches the image to the edges of the target without preserving the proportion: a 4:3 photo on a 1074 x 600 target comes out flattened, and the needle does not follow a stretched scale. Crop to the target's proportion before loading.
Centralize and Free (with Offset in X and Y) are for artwork smaller than the screen. The image carries only the dial faces: the needles become gauges (section 10.3). The application does not limit the image file size, and the day background and the night background add up in the map: the cost in the time to write and open the dashboard can only be checked on your unit (sections 14.6 and 14.7).
If the original dashboard has a night version, repeat in Night mode background and turn on Activate night mode. The screen hint says night mode is triggered together with the headlights, but the switch follows the day/night state of the VCU, from the Day/night mode function (section 5.3). The Simulate day/night mode icon shows the night background in the editor.
#10.3 Pointer: pivot and the angles of zero and end of the scale
A pointer is the image of a needle that turns around a point, as a function of a measurement. You provide the pivot and the needle angles at zero and at the end of the scale, and you can find the two angles without starting the car.
#Prepare the needle file
- Make the needle as a PNG with a transparent background, one per file. At angle 0° the image appears as drawn, so the rest position can be any one. For more definition than the 512 px cap of the PNG, use the SVG Pointer, with the same rotation fields.
- What must not rotate (axis cap, glass, reflection) goes in separate Image files, above the pointer in the Layers list (section 4.4).
- Draw the PNG square, with the needle axis at the center: the default pivot (Pivot X and Pivot Y at 0.500, as the field shows) already falls on the axis, and the gauge box, which starts at 60 x 60, has the proportion of the image. With the axis off center, keep Width and Height in the proportion of the PNG: the pivot is a fraction of the box, not of the image.
#Add and position
- Click Add gauge, open the Pointers group, choose Pointer PNG and confirm with Add gauge, at the bottom of the window. The editor asks for the file: choose the needle PNG.
- The pointer starts in front of all the others, at point 100, 100 of the canvas, at 60 x 60, already selected.
- In Layout, adjust X, Y, Width, Height and Scale (size on the screen = width times Scale). On the PC, a corner handle changes the scale without distorting; the keyboard arrows move 1 px, and Shift plus arrow, 10 px.
- Zoom in (25% to 300%): the canvas coordinates, in the upper left corner, help find the instrument axis on the background.
#Pivot
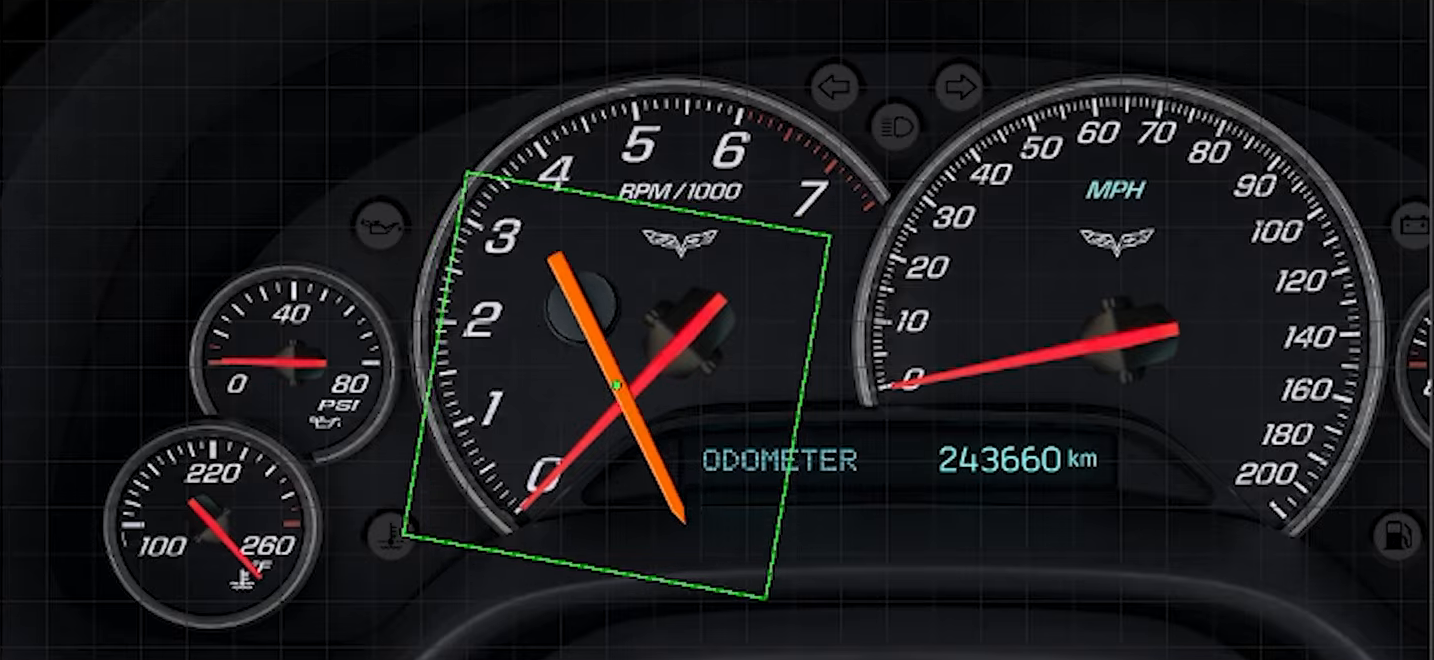
With the pointer selected, the editor shows a green dot: the pivot. On the PC, drag the green dot or type Pivot X and Pivot Y, from 0 to 1 over the gauge box (0.500 and 0.500 is the center; type the decimal with a period, section 4.2). In the touch editors, type the two fields. Move the pivot onto the axis of the drawn needle and then move the whole gauge until that point falls on the axis of the instrument painted on the background. You check it next, in Find zero and the end of the scale without starting the car.
#Values and angles
- In the Rotation section of the pointer panel, check Enable rotation. A new pointer starts with rotation off (the needle stays at 0°), and the fields Value 1, Angle 1, Value 2 and Angle 2 only appear with the box checked. Enable scaling is not needed for the rotation.
- In Data binding, choose the measurement in Data source (in the example, Engine RPM). Without a data source, the measurement value is 0.
- Value 1 is the value at the zero of the scale and Value 2 the value at the end (in the video, 0 and 7000). Type it in the unit the editor shows: the map's, or FuelTech Vision's if it uses its own units (section 9.3). If the map's unit changes later, the scale painted on the background does not change.
- Angle 1 and Angle 2 are the needle angles at those two values (in the video, -11° and 166°). The screen accepts from -3600° to 3600° and whole degrees only: the field rounds. Value 1 and Value 2 accept three decimal places.
- Between the two points, the angle is proportional to the value: angle = Angle 1 + (value - Value 1) ÷ (Value 2 - Value 1) × (Angle 2 - Angle 1).
Type decimals with a period, as in 0.5, and not 0,5: the field reads the number only up to the comma (section 4.2). After typing, check the value the field shows.
Do not confuse the two rotations: the Rotation section of the pointer turns the needle as a function of the measurement, and the Rotation field of Layout turns the gauge by a fixed value. The two add up, so leave the one in Layout at 0.
#Find zero and the end of the scale without starting the car
With no VCU connected, or with the engine stopped, the tachometer value is 0. With Value 1 at 0, the needle then sits at Angle 1, and you can move it by typing in that field: this is how to find the two angles with the car off.
- Check the pivot. Type 0, 90 and -90 in Angle 1: the base of the needle must stay still on the axis while the tip moves. If the base shifts, the green dot is not on the axis of the needle: adjust Pivot X and Pivot Y. If the needle does not move, check Enable rotation and Value 1.
- Find the zero angle. Type whole values in Angle 1 until the tip covers the zero of the scale painted on the background (in the video, -11°). To find out which way the angle grows, type 30. Write down the result.
- Find the end angle: keep typing in Angle 1 until the tip covers the mark at the end of the scale (7000, in the video 166°). Type that angle in Angle 2.
- Put back in Angle 1 the zero angle you noted in step 2.
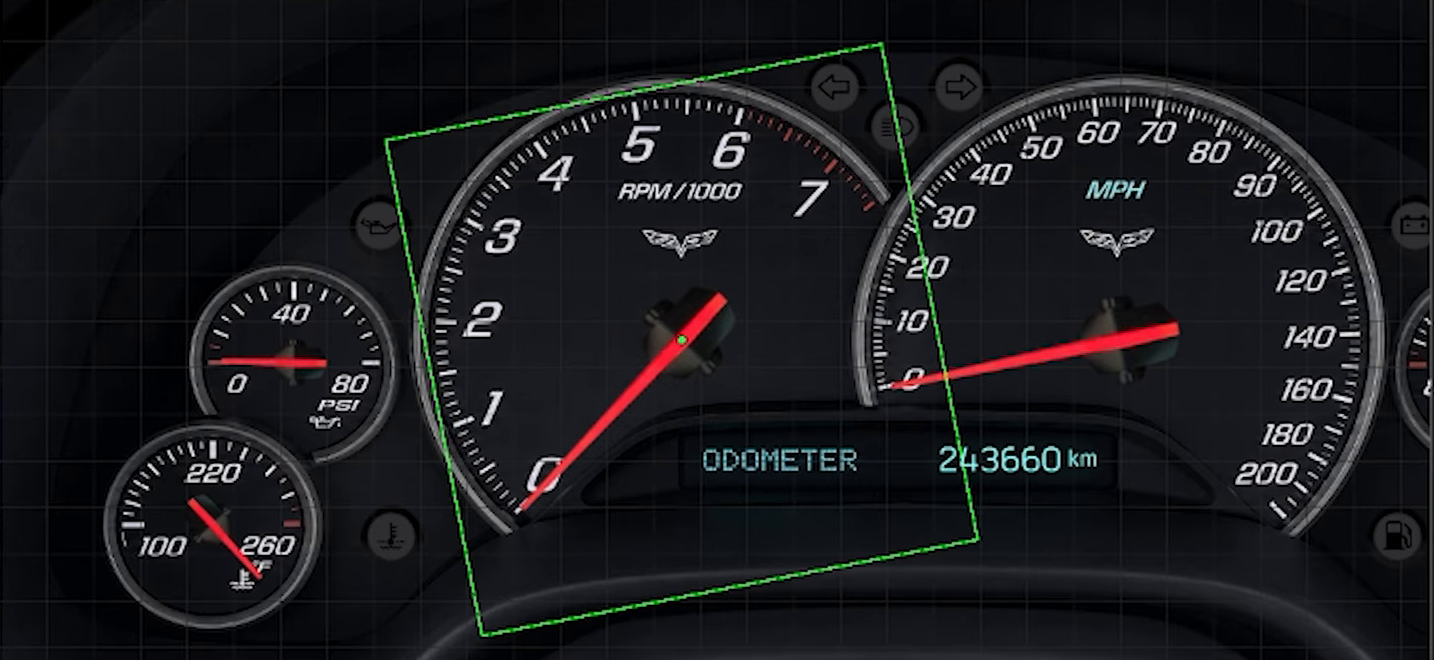
After any test typed in Angle 1, put the zero angle back. Forgetting this leaves the needle off zero with the engine stopped. The editor's Undo keeps up to 50 steps.
#Check the middle of the scale
Calculate with the formula in step 5 the angle of a point in the middle of the scale and type it in Angle 1 (engine stopped, Value 1 at 0): the tip must fall on the mark on the background. In the example (0 to 7000 RPM, from -11° to 166°), 3500 RPM gives 77.5°, typed as 78°. If the marks in the middle do not fall under the tip, the scale of the original is not uniform: the pointer follows a straight line between two points. Choose the two that matter most, for example the range in which the engine works, and accept the error at the ends.
#Pointer limits
- No end stop. Above Value 2 the needle keeps turning past Angle 2, and below Value 1 it turns before Angle 1. Set Value 2 to the highest value the painted scale shows and check what the engine reaches.
- Inside a Group the pointer does not rotate by value. If you grouped gauges to move or scale them (section 11.5), ungroup them before testing the needle.
#Repeat for the other pointers
For the other instruments, duplicate the finished pointer with the copy icon of the row, in the Layers tab: the copy comes out offset by 20 px and goes to the end of the list. Change the position, Data source, values and angles, and check the order of the layers.
#10.4 Warning light by image and by 2-frame GIF
A warning light is an image that appears, or changes, when a measurement passes a limit. There are two paths. The image with Conditional visibility works for any measurement, including on/off ones (0 or 1), and has hysteresis: it turns on at one value and off at another. The 2-frame GIF switches at the midpoint between Initial value and Final value, without hysteresis. The tablet editor does not have the Conditional visibility section, but it has the GIF fields.
#Light by image
- Click Add gauge, open the Primitives group, choose Image and confirm with Add gauge. Choose the file of the light (PNG for an icon with transparency: JPEG does not keep it). The panel shows Loaded (W × H) with the final size.
- In X, Y and Scale, position the image over the lamp painted on the background.
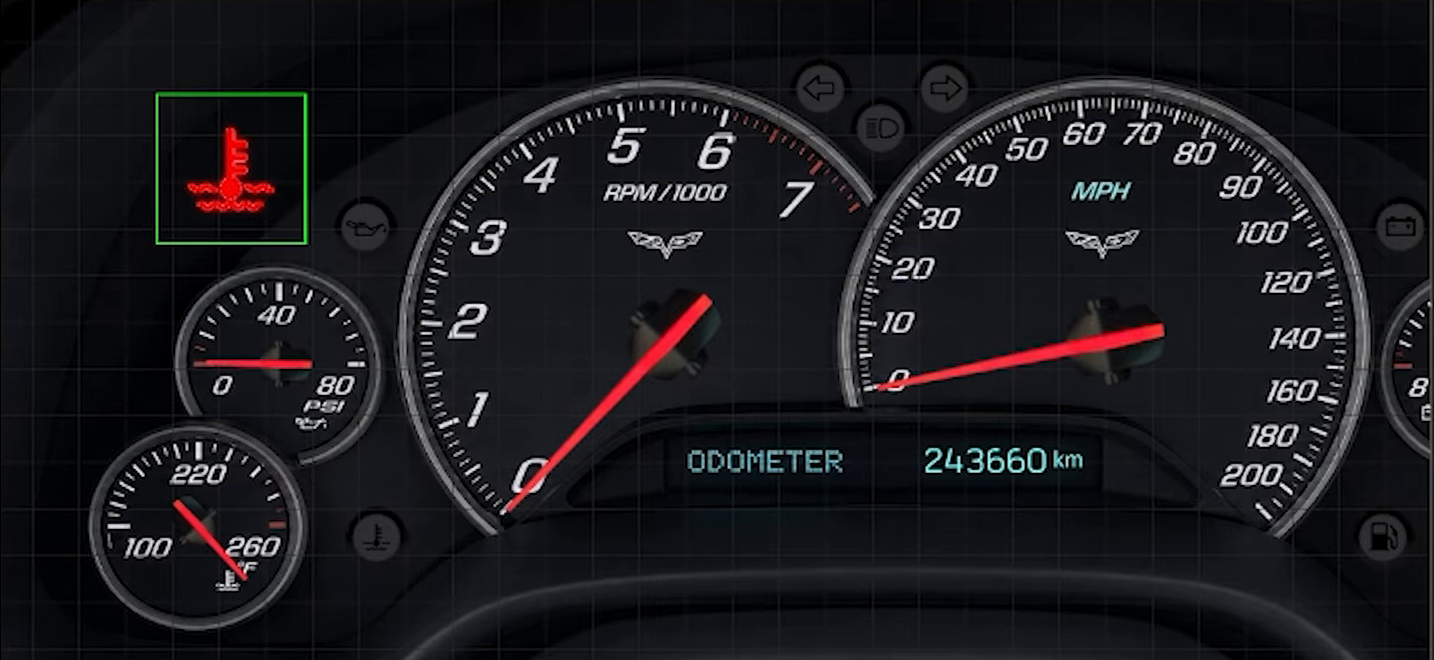
- In the Conditional visibility section, in Mode, choose Above the upper limit. In Data, choose the measurement in the Choose item selector and confirm with Ok (in the example, Engine temperature).
- Fill in Turn on above with 100 and Switch off below (hysteresis) with 95, in the unit the editor shows (°C in the example).
The light turns on when the temperature goes above 100 °C, goes off when it falls below 95 °C and, between the two, stays as it was. The badge on the panel shows Component now visible (green) or Component now hidden (shown opaque in the editor) (red). The other modes (Below the lower limit, Within the range (intra) and Out-of-range (extra)) are in section 7.5; the last two have no hysteresis.
For an on/off measurement, such as High beam, Turn signal - Right and Turn signal - Left, the value is 0 or 1 and the limit fields offer OFF and ON. Use Above the upper limit with Turn on above at OFF and Switch off below (hysteresis) at ON: value 1 turns on and value 0 turns off.
Always type both fields. On a measurement with a number, such as temperature or pressure, the off field is smaller than the on field (100 and 95): with Switch off below (hysteresis) at 0, the light starts on and, for a measurement that never goes below 0, never goes off. On an on/off measurement the pair above applies, OFF and ON, in which the off one is larger: with the lower field larger, the turn-on condition wins (section 7.5).
With no measurement chosen in Data, the light is always visible. It also starts visible: if the first value falls between the two limits, it stays visible until the value crosses one of them. Before the VCU sends the first value, the measurement is 0 (the lambda sensor is 1): a low oil pressure light on with the engine stopped is expected (section 7.5).
#Light by 2-frame GIF
- Click Add gauge, open the Primitives group, choose GIF and confirm with Add gauge. In GIF File, use Load GIF... and choose the file. The panel must show Loaded (2 frames): frame 1 is the lamp off and frame 2 the lamp on.
- In Data binding, choose the measurement in Data source (in the example, Engine temperature).
- In Animation mapping, choose Position (value -> frame). Fill in Initial value with 90 and Final value with 100, as in the video.
- The GIF shows the frame closest to the value: with 2 frames, frame 2 appears from the midpoint of the range, 95, and not at 100. Below the start it stays on frame 1, and above the end, on the last one.
To turn on at a limit X, use Initial value equal to X minus d and Final value equal to X plus d, with d greater than the resolution of the measurement (X = 95 and d = 1: type 94 and 96). With the start equal to the end, the GIF always stays on frame 1.
Without hysteresis, the GIF toggles if the value oscillates around the limit: to have hysteresis, use the image with Conditional visibility.
Without a Data source, the GIF loops on its own, and the screen warns you.
#10.5 RPM bar by GIF
The RPM bar of old digital dashboards, with segments that light up in steps, is made with a multi-frame GIF, each frame with one more segment than the previous one, linked to Engine RPM in the Position (value -> frame) mode.
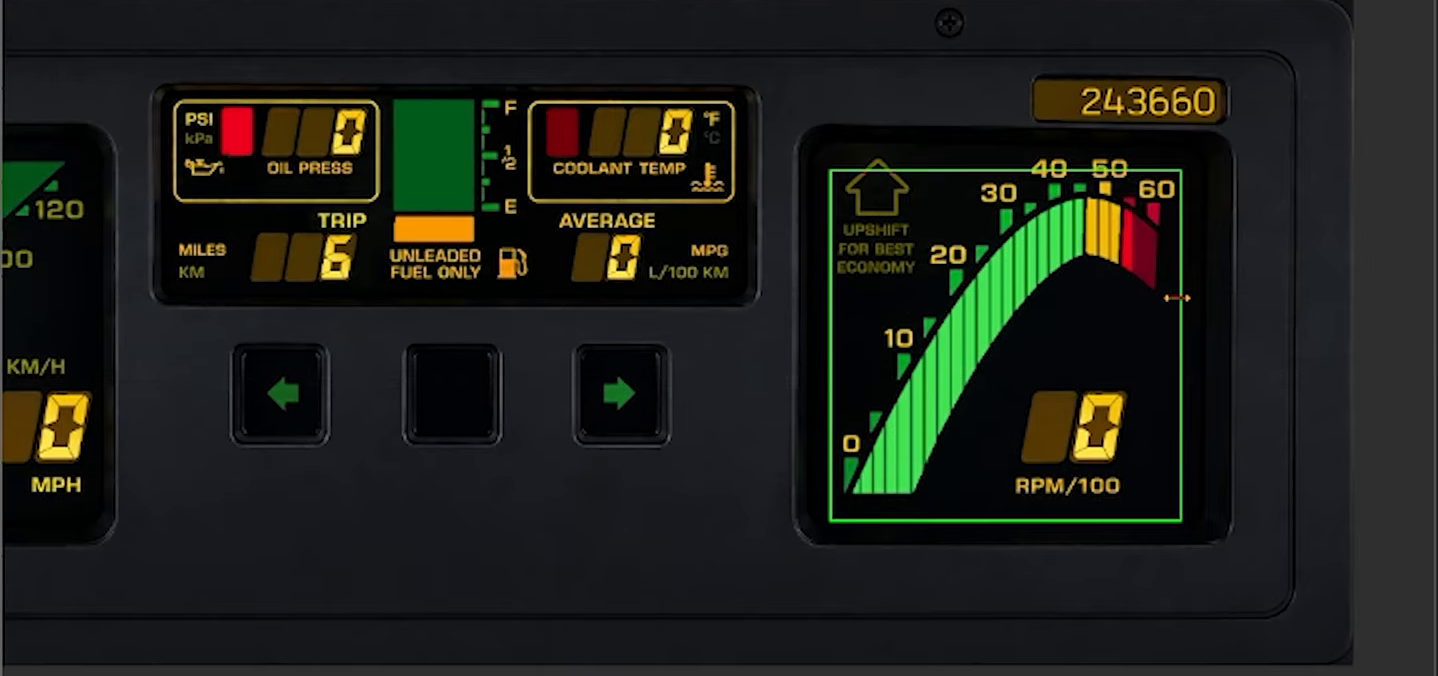
- Draw the frames in the image program, all the same size: frame 1 is the bar off, and each following one lights one more segment (25 frames give 24 segments). Export the GIF with 50 ms (5 hundredths of a second) or more per frame (see the warning below).
- Add the GIF as in section 10.4 (Primitives group, GIF, Load GIF...). The panel shows Loaded (25 frames).
- Adjust Width, Height and Scale until the GIF exactly covers the bar drawn on the background, with Preserve aspect ratio on and the GIF in the proportion of the box. In the video: 80 x 80 with Scale 4.66x.
- In Data binding, choose Engine RPM in Data source. In Animation mapping, choose Position (value -> frame), with Initial value at 0, Final value at 6000 and Invert direction unchecked. The line Current value: 0.00 | frame: 1 / 25 confirms it.
The panel shows the frame closest to the value. With 25 frames from 0 to 6000 RPM, each frame covers 250 RPM, and the first and the last cover half a step. The screen counts the frames from 1:
| Frame | Appears when the RPM is | Lit segments (frame 1 off) |
|---|---|---|
| 1 | Below 125 | 0 |
| 24 | From 5625 to 5874 | 23 |
| 25 | At 5875 or more | 24 |
For the segment to light when the RPM passes its number, and not half a step before, shift both values half a step up: Initial value at 125 and Final value at 6125. Segment 1 lights at 250 RPM and segment 24 at 6000 RPM.
For segments at uneven RPM values, repeat frames in the GIF (50 ms or more on each, up to 300 frames kept on any device). Without needing the original artwork, the RPM bar gauge (section 6.5) makes an RPM bar without a GIF.
#10.6 Import a ready-made dashboard and adjust it
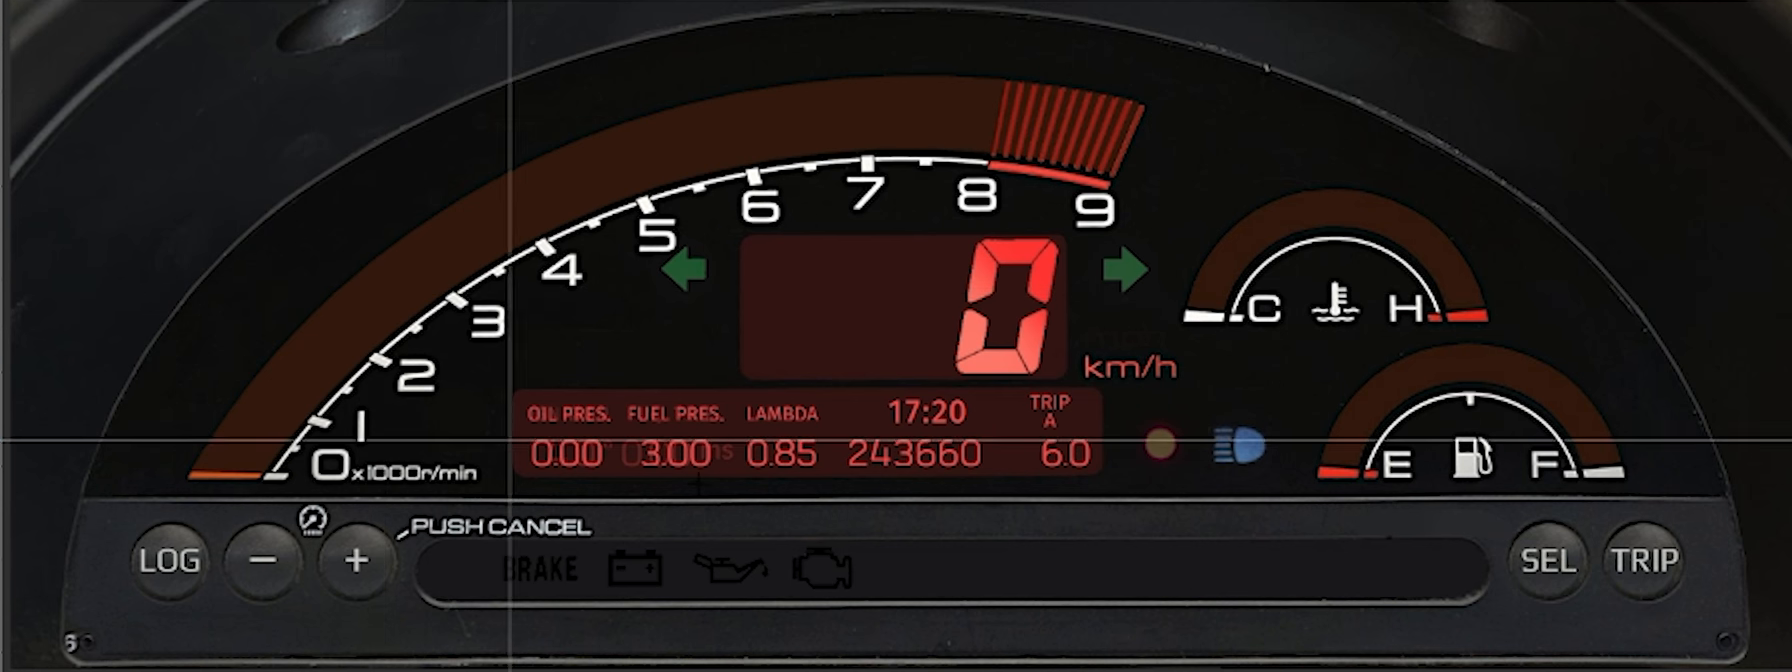
Import brings the full screens of a dashboard from a .ftds file: gauges, title, day background, night background and night mode, with the images and GIFs. Only the PC editor imports.
- Check the target. The editor must be on the same target as the file (for example VCU (FT700 Plus) for a Plus dashboard): the application does not check the target or the resolution (section 13.3). A 1074 x 600 dashboard imported on the 1920 x 720 target ends up in the upper left corner, with the background stretched: the needles no longer fall on the artwork.
- Save what you have done and export the destination screen as .ftds (section 13.2). The import replaces the whole destination screen and clears the Undo history.
- In the top bar, click the Import dashboard from .ftds file icon. In the Windows Import Dashboard window, choose the .ftds file.
- In the application's Import Dashboard window, check Source: ...: if the target is different from the editor's target, click Cancel (to take a dashboard from one target to another, follow section 11.5). If it is the same, choose for each screen of the file the destination screen (Screen 1, Screen 2...) or Do not import: the list only offers the screens the target already has, so increase Number of screens first, if needed. The warning "The selected screens will be overwritten" reminds you that the destination screen loses its content.
- Click Import. The imported screens are already in the open map, and nothing goes to the VCU until Write.
After importing, check:
- Data source of each gauge. An empty field is a measurement that no longer exists: an Odometer from an old dashboard may be left with no data, and you choose Odometer or Trip odometer again.
- Units. If the painted artwork uses another unit (km/h on the background, mph in the map), the needle follows the painted scale, but the digital numbers show mph.
- ECU Buttons. The file carries only the Command of each ECU Button: check each one, because with start enabled in the map a start button starts or shuts off the engine (section 8.1).
- Texts. The text painted on the background and the titles saved in the file do not change with the application language: change the Custom title or redo the artwork. Also adjust Number of screens and Initial screen.
A .ftds file made on the phone or tablet, with Save as local dashboard, has another format, with several targets: the PC editor rejects it with the message Invalid file format (missing mandatory fields) (section 13.4). To take your dashboard to another map, use the Export dashboard to .ftds file icon: Export saves the checked screens, with images and GIFs, only for the open target.
#10.7 Check with the engine running and write
#Before writing
Check the background, each pointer (with Angle 1 back at the zero angle), each light, the order of the Layers list (axis cap above the needle), Number of screens and Initial screen, and click Save changes. To check the tachometer with the engine running, put a Digital gauge with Engine RPM in a corner of the screen, just for the test, and remove it afterwards.
#Write to the VCU
The full steps are in section 3.1 and the modes in section 13.1. For this method:
- Always write with the engine off and the car stopped (section 13.1).
- On the PC, click Write (tooltip Write VCU) and confirm Override VCU?. On the phone and the tablet the button is Write VCU, with no confirmation.
- The whole map goes, with all the images and GIFs of all the targets: each Write resends everything.
- If the dashboard was open on the VCU, it reloads by itself and may show the Loading dashboard screen. If another screen was open, the VCU returns to the menu and does not open the dashboard: open it from the menu (to open straight into the dashboard at power-on, section 3.2).
To test the dashboard without changing the active map, open the arrow next to Write, choose Save map and not activate (it does not ask for confirmation) and use Make active on the VCU's files screen when you want to.
#Check with the key on and the engine off
- The background covers the screen with no bands or distortion (on the 7", the circle comes out round), and the RPM bar shows frame 1, off.
- The tachometer and speed needles rest at zero (needle at Angle 1). The others point to the real value the VCU sends, such as the battery voltage.
- The lights are in the state the rule predicts: low oil pressure (Below the lower limit with Turn on under greater than 0) on with the engine stopped, high temperature (Above the upper limit) off with the engine cold. A sensor that is not connected may send a value outside what is expected, and it varies from one measurement to another (section 9.6).
- To test a temperature light without heating the engine, still with the engine off, lower both limits below the temperature the dashboard shows (for example, Turn on above 5 °C below the reading and Switch off below (hysteresis) 10 °C below), save, write and see the light come on. Then put the limits back to the right value and write again, also with the engine off. Always test by lowering the limits: if forgotten, they leave the light always on, and do not hide a warning.
#Check with the engine running
With the car stopped, check only what can be checked safely. Nothing is written here.
- Compare the tachometer needle with the number on the test Digital gauge, at two or more points beyond zero: one near the middle of the scale and one near the end. If you cannot take the engine to the end, trust the calculation in section 10.3. The RPM bar must follow the engine speed (table in section 10.5).
- Battery voltage and the other needles: compare with a second instrument or with a number on the same dashboard. Speed can only be checked with the car moving: compare with a second instrument, in a safe environment, with another person reading the dashboard.
- With more than one screen, check each one.
#Adjust and write again
Each adjustment made on the PC requires Save changes and a new Write, always with the engine off. The numeric fields (angles, values and limits) can also be adjusted in the VCU's own editor, in Interface > Dashboard setup, where Save writes the unit's map right away. Images and GIFs do not load in that editor.
#10.8 The numbers from the video
The values from the video (tachometer, light by image, light by GIF, RPM bar and import) are in the examples in sections 10.3 to 10.6: recalculate each one for your car.
#10.9 Short gallery of ready-made dashboards